A large-scale analysis of when and why people choose smaller-sooner rewards
over larger-later ones — with predictive models and actionable recommendations
for streaming subscription tier optimization.
800k+Trials analyzed
20+Countries
~1.29×Tipping ratio
3Predictive models
01 — Overview
The Problem
Intertemporal choice — the trade-off between a smaller, sooner reward (SS) and a larger, later one (LL) —
is fundamental to decisions in finance, health, and product design. We analyzed a large
multi-study dataset to uncover the key factors driving these choices, identify tipping points,
and derive actionable design recommendations.
Core question: What makes people willing to wait for a bigger reward —
and how large does the incentive gap need to be before they switch from "now" to "later"?
02 — Data Cleaning
Preparing the Dataset
Raw data spanned multiple studies with heterogeneous formats. Our cleaning pipeline enforced
consistent typing, removed flagged exclusions, and preserved data richness while controlling outliers.
Step 01
Type Enforcement
Coerced choice to binary 0/1, numeric columns to float, trimmed string IDs.
Step 02
Missing Values
Dropped rows missing core columns: SS/LL values and times.
Step 03
RT Outliers
Winsorized response times at the 99.5th percentile — capped, not deleted.
Step 04
Exclusions
Removed subject- and trial-level exclusions flagged by original study authors.
Design choice: We winsorized RT rather than dropping extreme rows, preserving
data richness while reducing the impact of outliers on downstream analysis.
03 — Key Findings
What the Data Tells Us
Delay Structure: What's the Typical Trade-Off?
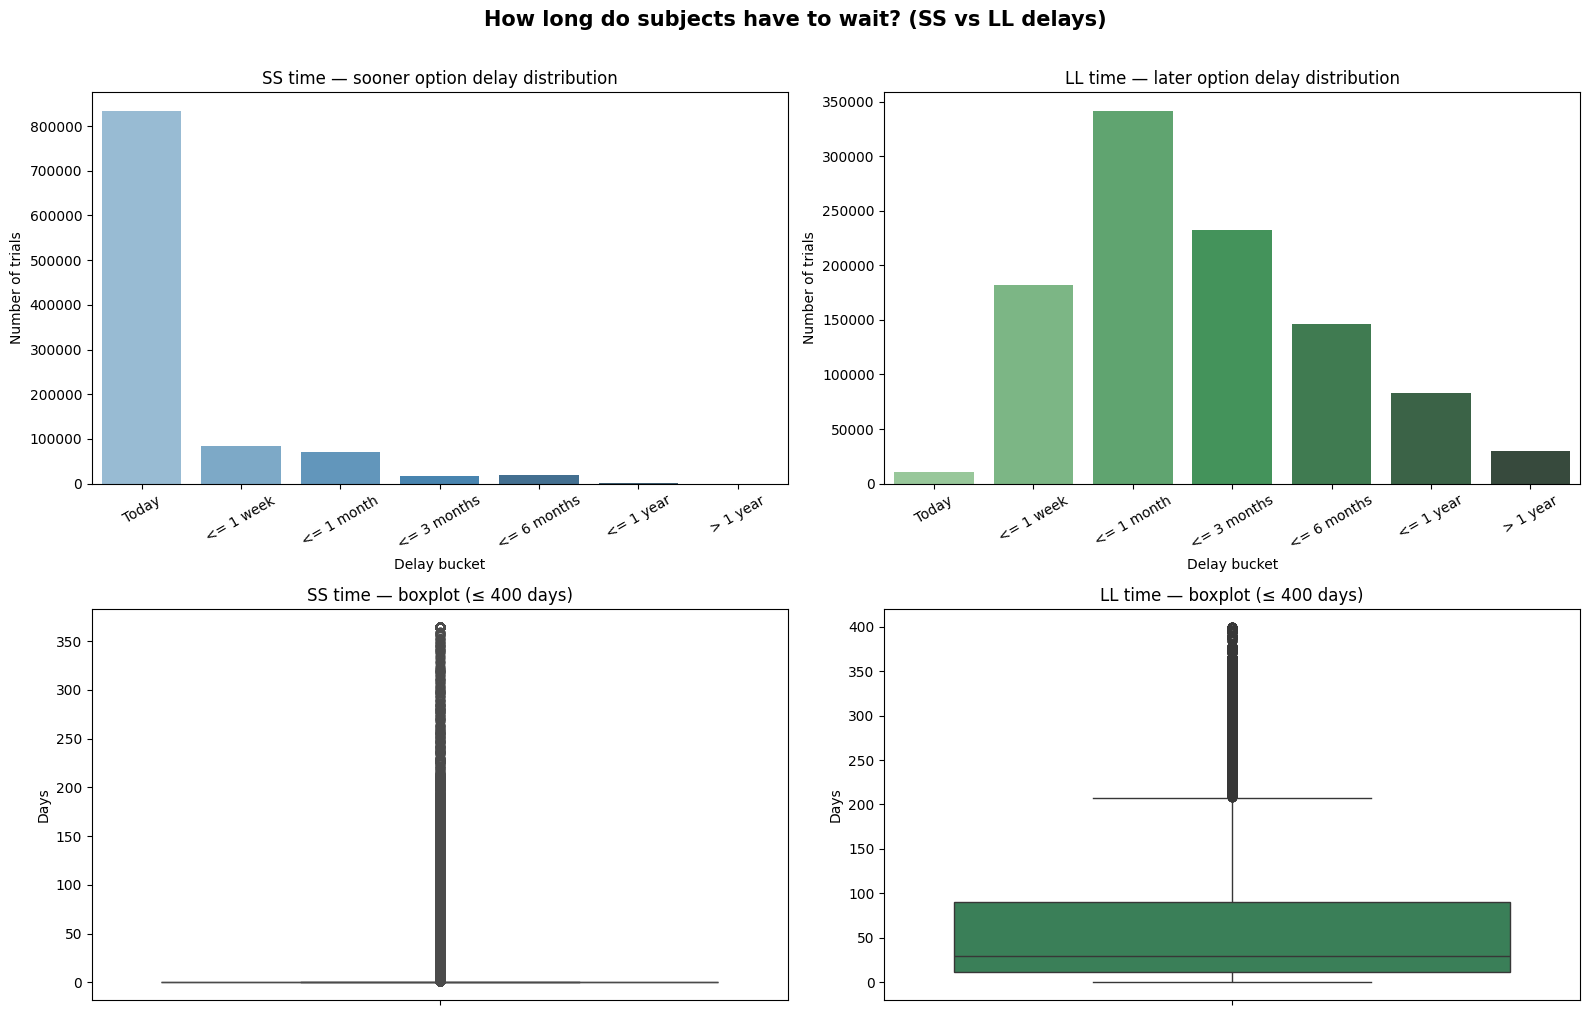
Most SS options are immediate (81% at 0 days), while LL delays center around ~30 days.
The typical trial presents a "now vs. one month" trade-off, though extreme outliers exist in both tails.
SS vs LL Delay DistributionsQ1
Top: count of trials per delay bucket (SS mostly "Today"; LL peaks at ≤ 1 month).
Bottom: boxplots of raw delay in days, capped at 400 for readability.
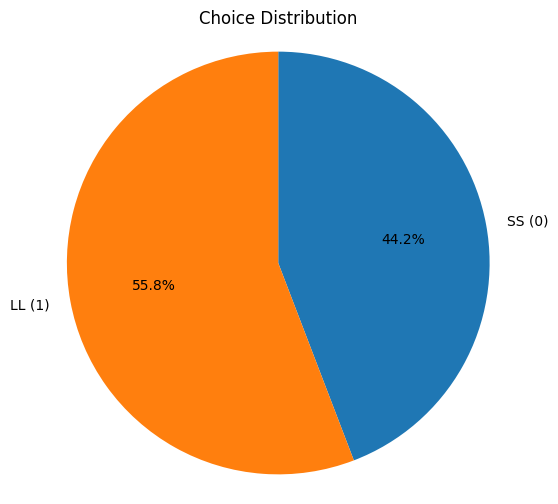
Overall Choice Distribution
Across all trials, the dataset is roughly balanced between SS and LL choices, indicating
no extreme global bias toward patience or impatience.
SS vs LL Choice SplitQ2
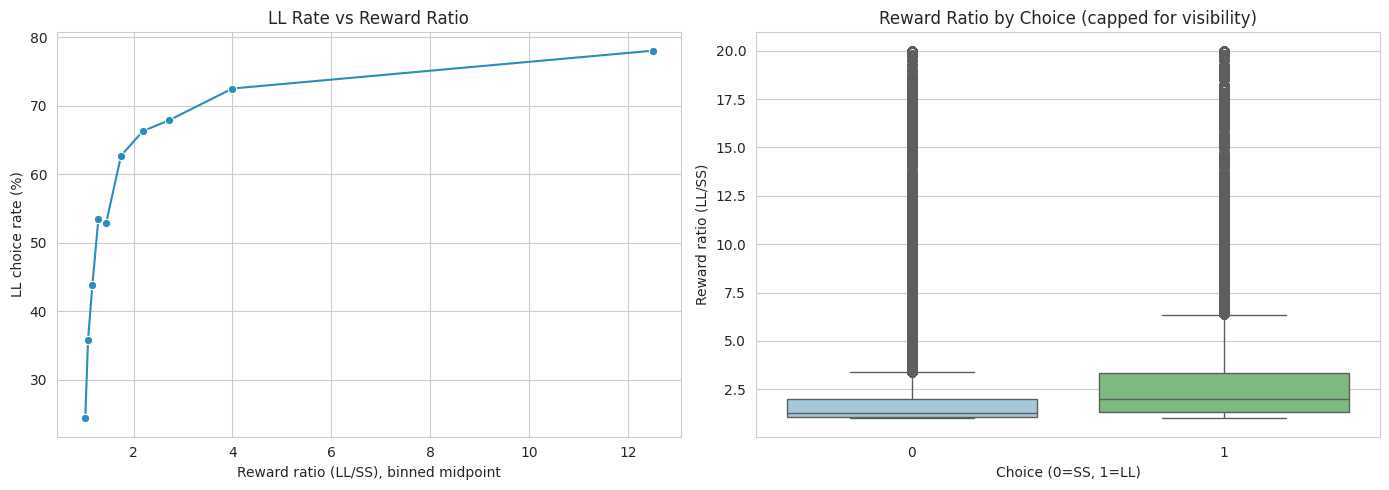
The Tipping Point: How Big Must the Reward Gap Be?
We computed the reward ratio (LL value ÷ SS value) and binned it into deciles. The LL choice rate
climbs steadily — crossing the 50% mark at approximately 1.29×. Below that, most people
take the immediate option; above it, patience wins.
~1.29×
Tipping ratio (LL ≥ 50%)
↑ Monotonic
LL rate trend with ratio
~2.0
Median reward ratio
LL Rate vs Reward Ratio & Ratio by ChoiceQ3
Left: LL choice rate (%) rising with reward ratio bin midpoint.
Right: boxplot confirming LL choices cluster at higher ratios than SS choices.
Business implication: Users need the larger-later option to be at least
~29% more valuable before they'll choose to wait. Design upgrade offers accordingly — a thin
value gap loses to the immediate option.
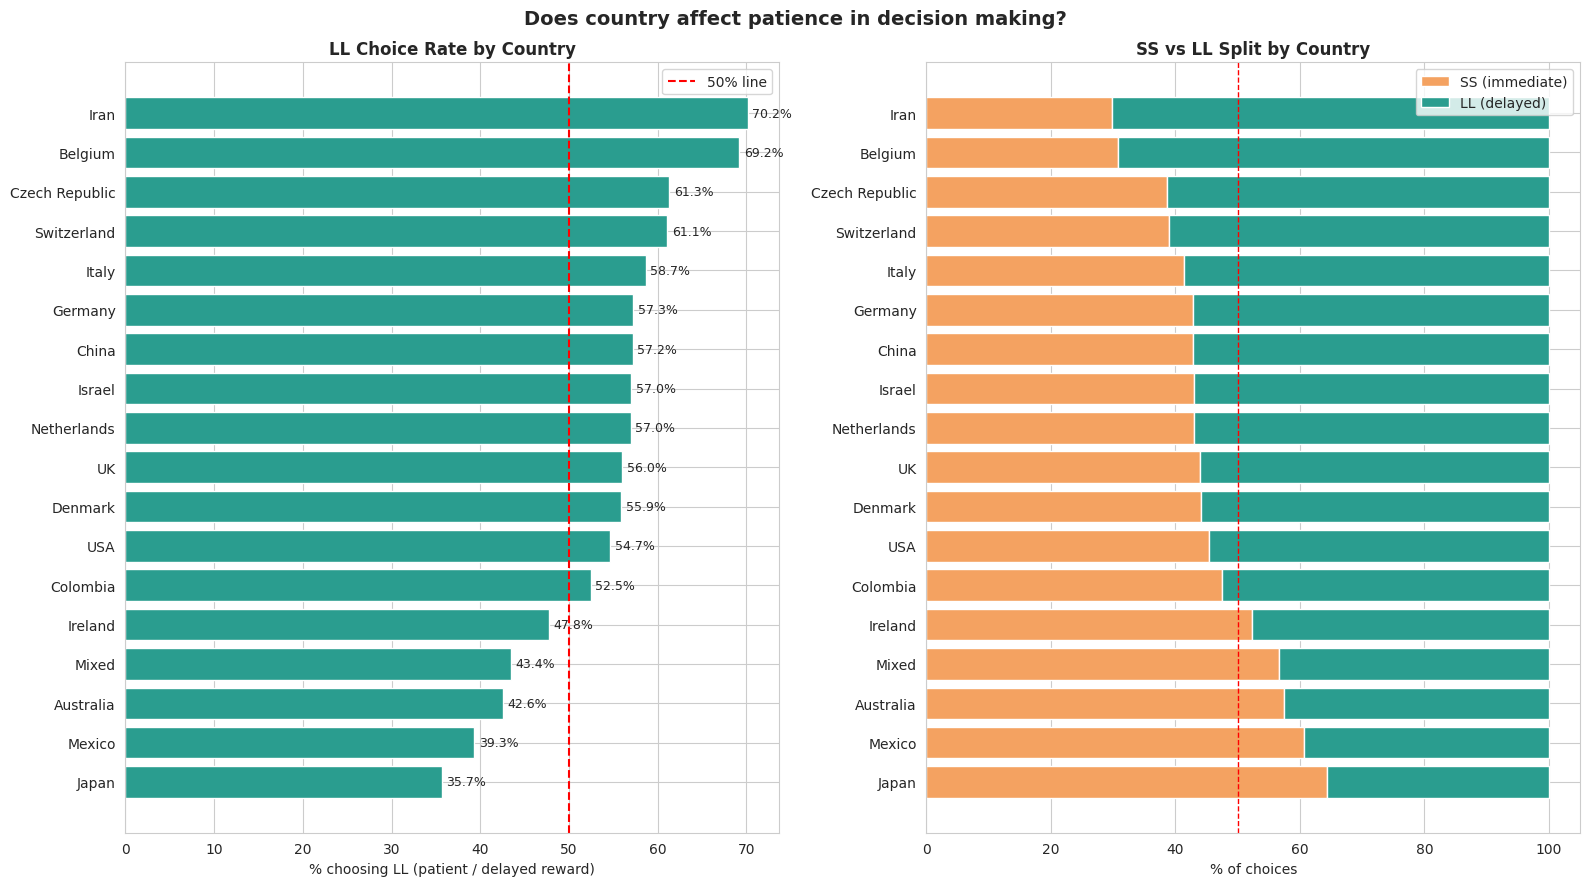
Geographic Variation
LL choice rates vary meaningfully across countries (filtered to n>500 trials each).
However, country is a coarse proxy — experimental design, sample demographics, and study context differ
across geographies, so these differences should not be interpreted as pure cultural effects.
LL Choice Rate by CountryQ4
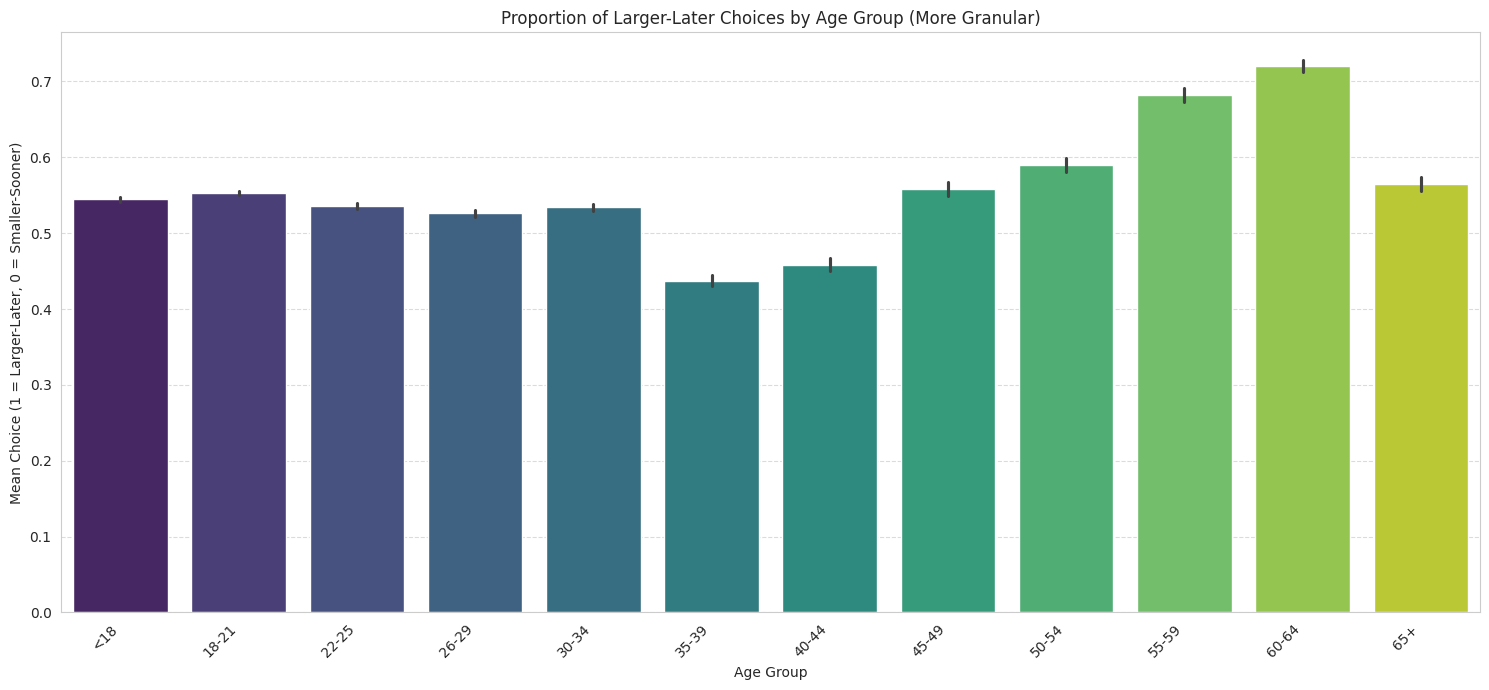
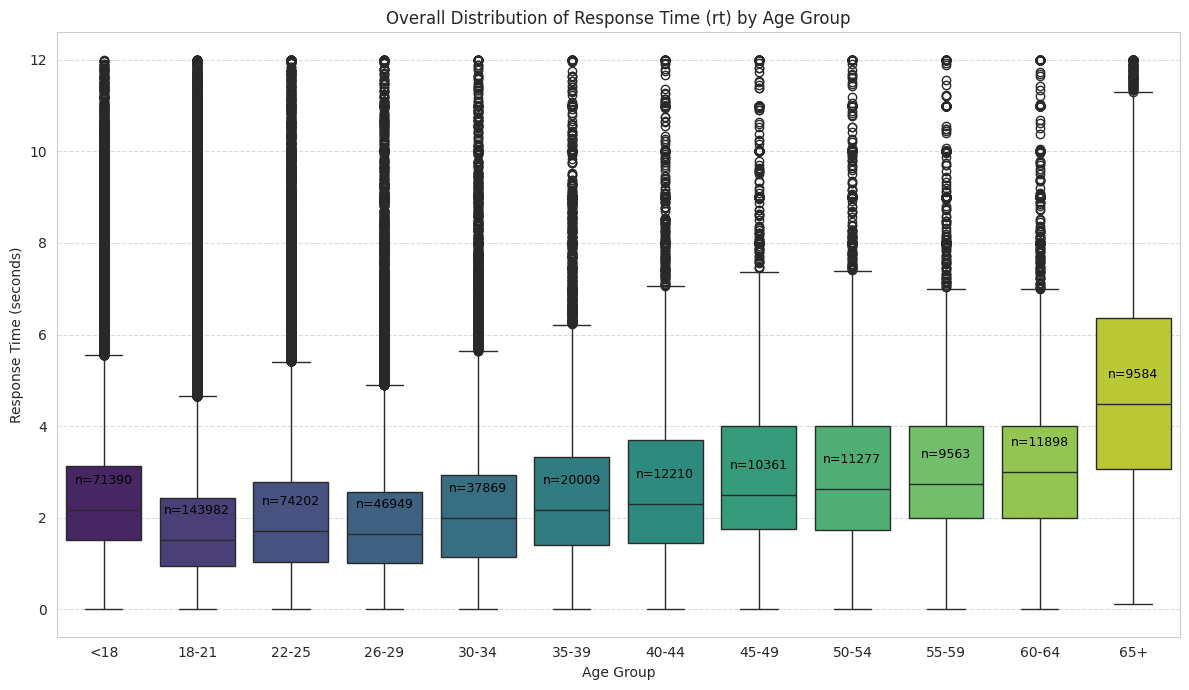
Age & Decision Behavior
We binned participants into granular age groups to avoid hiding real distributional patterns.
Younger adults show faster, more consistent response times, while older adults are slower and more variable.
The relationship between age and patience (LL rate) is non-linear.
LL Choice Rate by Age GroupQ5a
Response Time Distribution by Age GroupQ5b
Speed slows with age and consistency decreases — older groups include both fast and very slow responders.
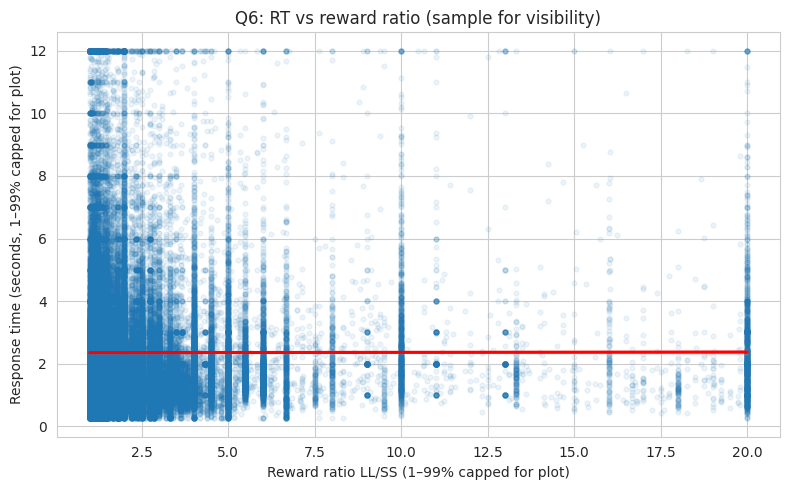
Does Difficulty Slow People Down?
We tested whether higher reward ratios (easier decisions) lead to faster responses.
The correlation is negligible — response time appears largely independent of the reward gap in this dataset.
Response Time vs Reward RatioQ6
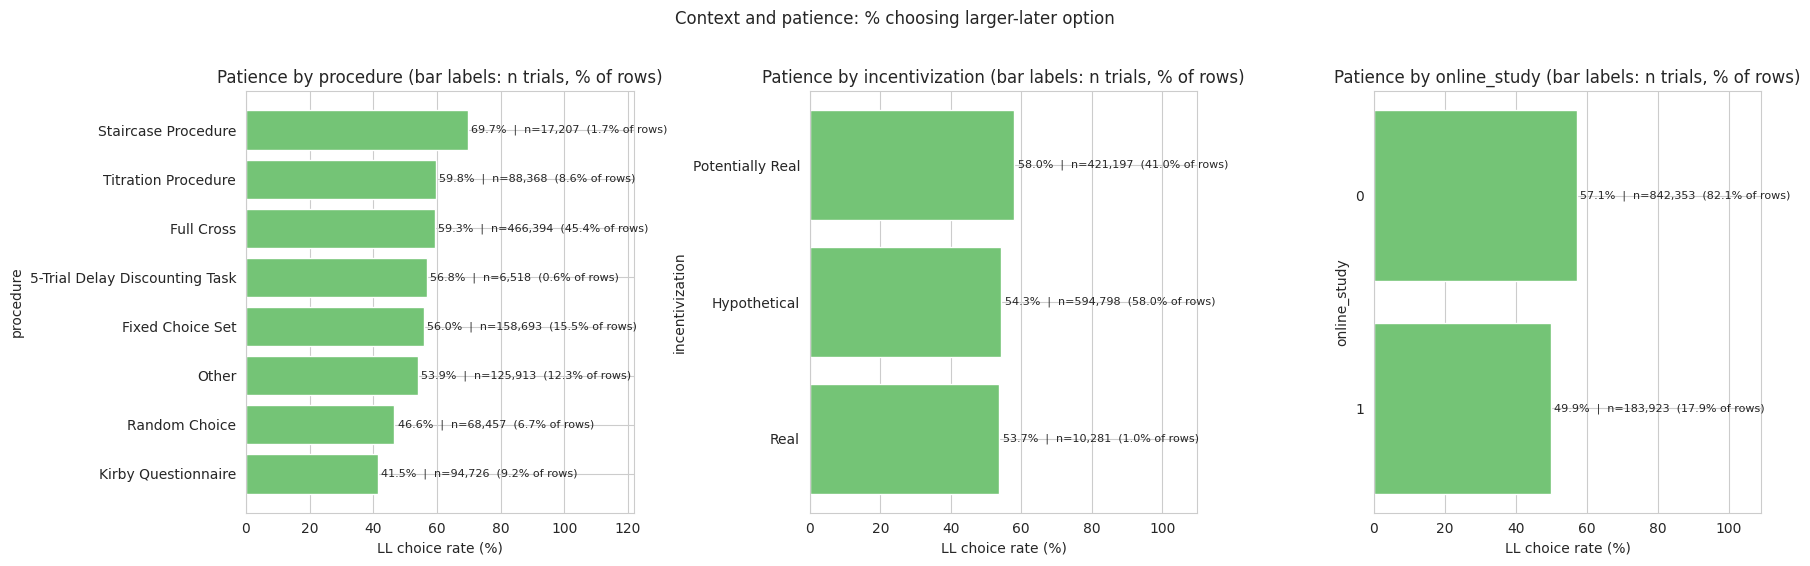
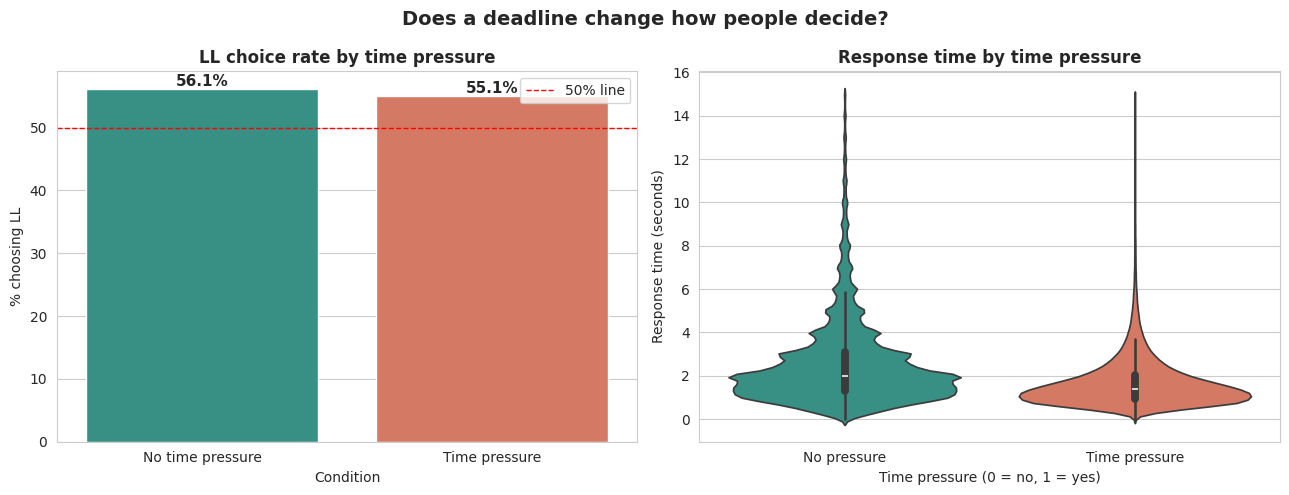
Context Matters: Procedure, Incentives & Setting
Task type (procedure) showed the largest spread in LL rates — roughly 30 percentage points across categories.
Online vs. in-lab produced a smaller but real ~8pp gap. Incentive framing had minimal impact (~4pp).
Practical takeaway: Before claiming segment differences in patience,
experiment format and channel context must be controlled or disclosed — task design
drives more variation than individual traits in this dataset.
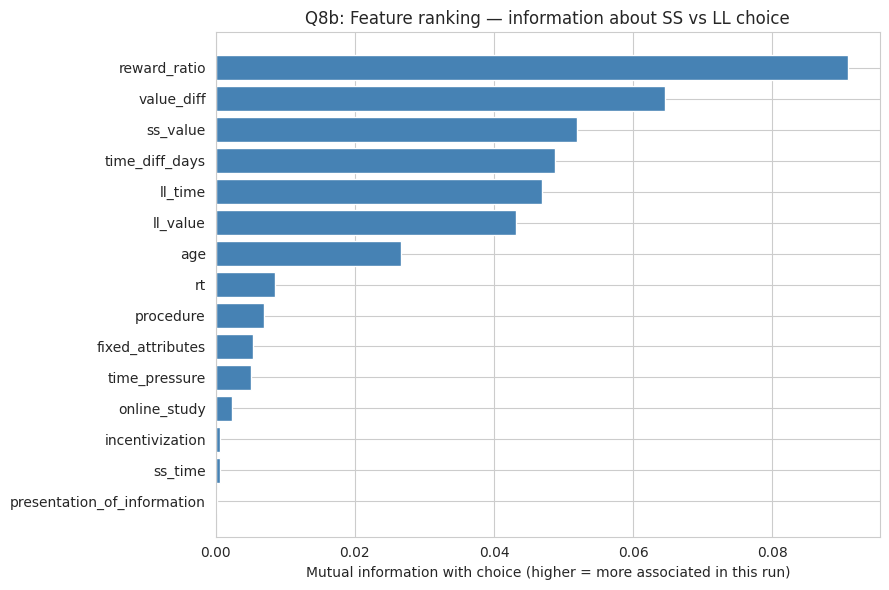
04 — Feature Importance
What Predicts Choice?
We ranked all available features by mutual information (MI) with the binary SS/LL choice.
MI captures any statistical association — including non-linear relationships — making it a good
first-pass ranking before modeling.
Mutual Information RankingQ8
Reward amounts and delays rank highest (expected — they define the task). Context variables like
procedure and incentivization matter for fair cross-study comparisons.
Interpretation note: High MI for reward amounts partly reflects task structure
(every trial varies these quantities). Context variables with lower MI can still be critical
for causal interpretation and study design.
05 — Predictive Modeling
Can We Predict Who Waits?
We trained three classifiers to predict SS (0) vs LL (1) choice using task-level features,
behavioral signals, and contextual variables. Data was split 80/20 with stratified sampling,
subsampled to 300k rows for training efficiency (seed = 42).
3
Models compared
17
Input features
80 / 20
Train / Test split
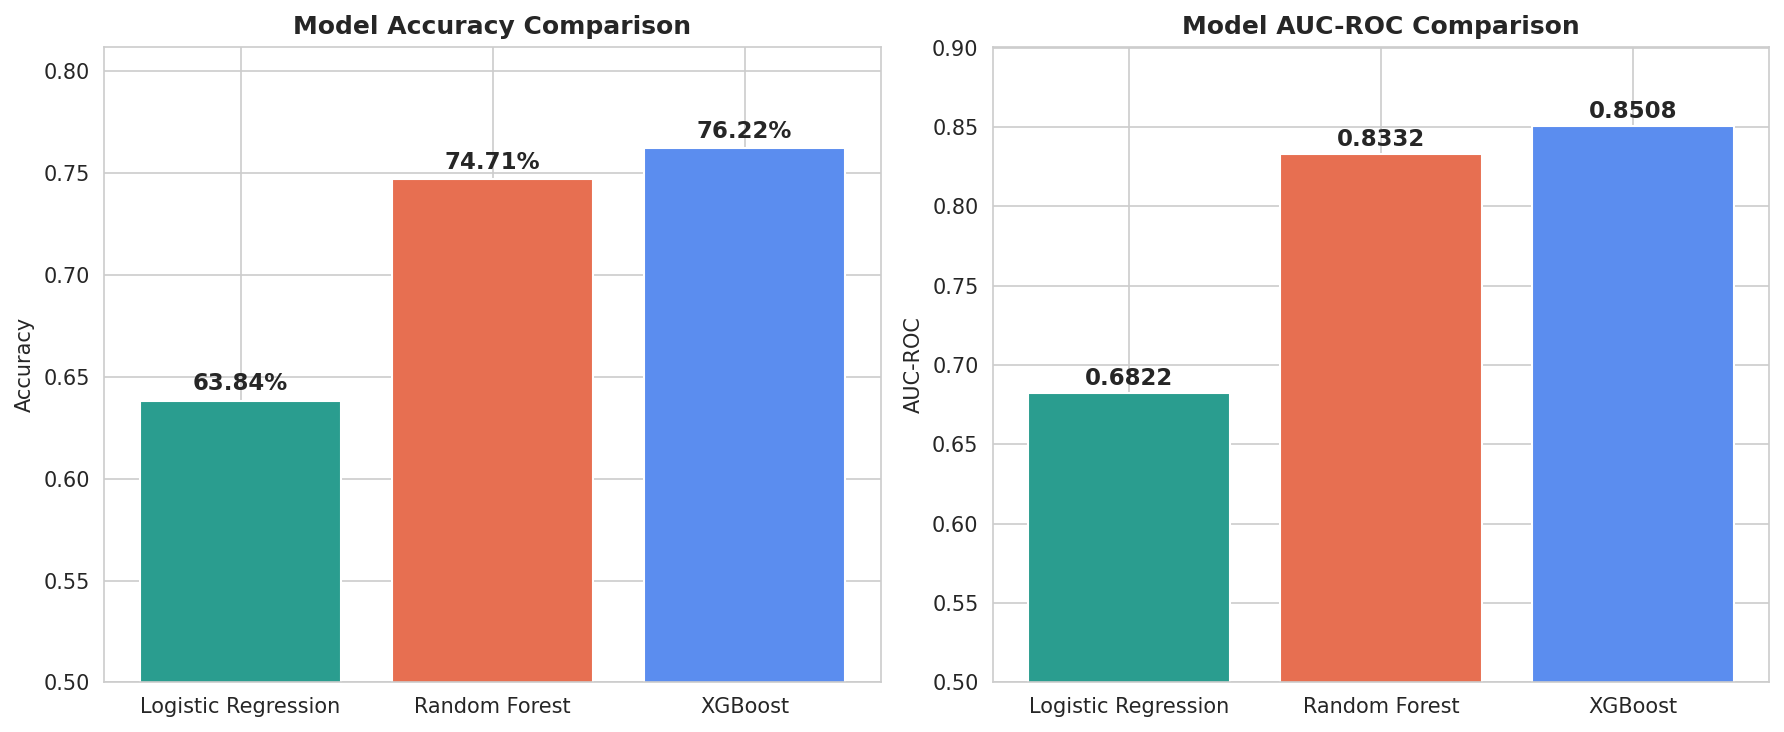
Why These Three Models?
Logistic Regression — our interpretability anchor. Signed coefficients tell us
the direction and magnitude of each feature's effect. A positive coefficient for reward_ratio
means higher ratios push toward LL (patience). This is what we use for business recommendations.
Random Forest — captures non-linear interactions (e.g., how age modifies the
effect of reward ratio) without manual feature crossing. Feature importances confirm or challenge
the MI ranking from our EDA.
XGBoost — our performance ceiling. Gradient boosting typically achieves the
highest accuracy on tabular data, giving us a benchmark for how much signal exists in the features.
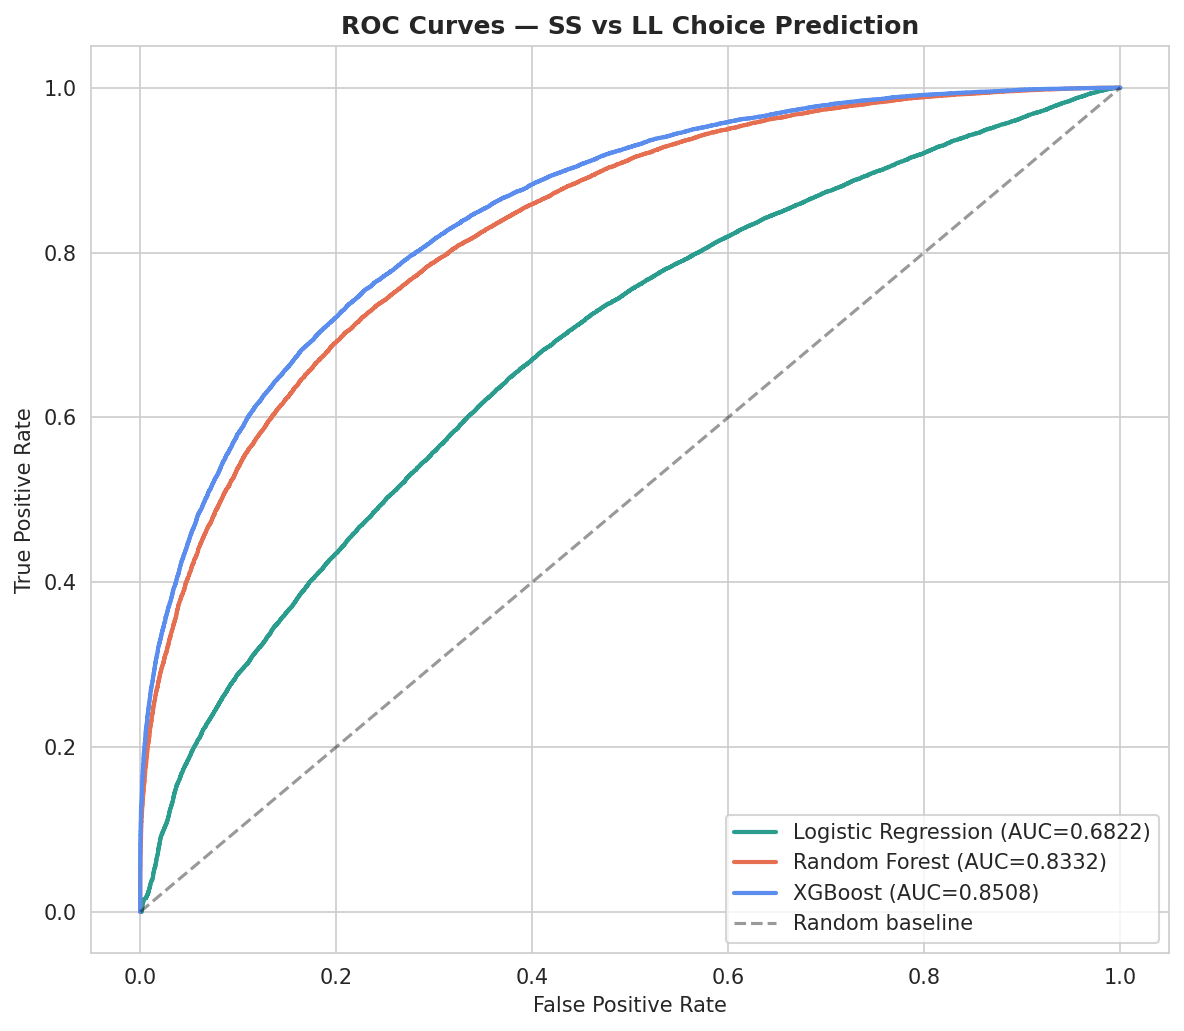
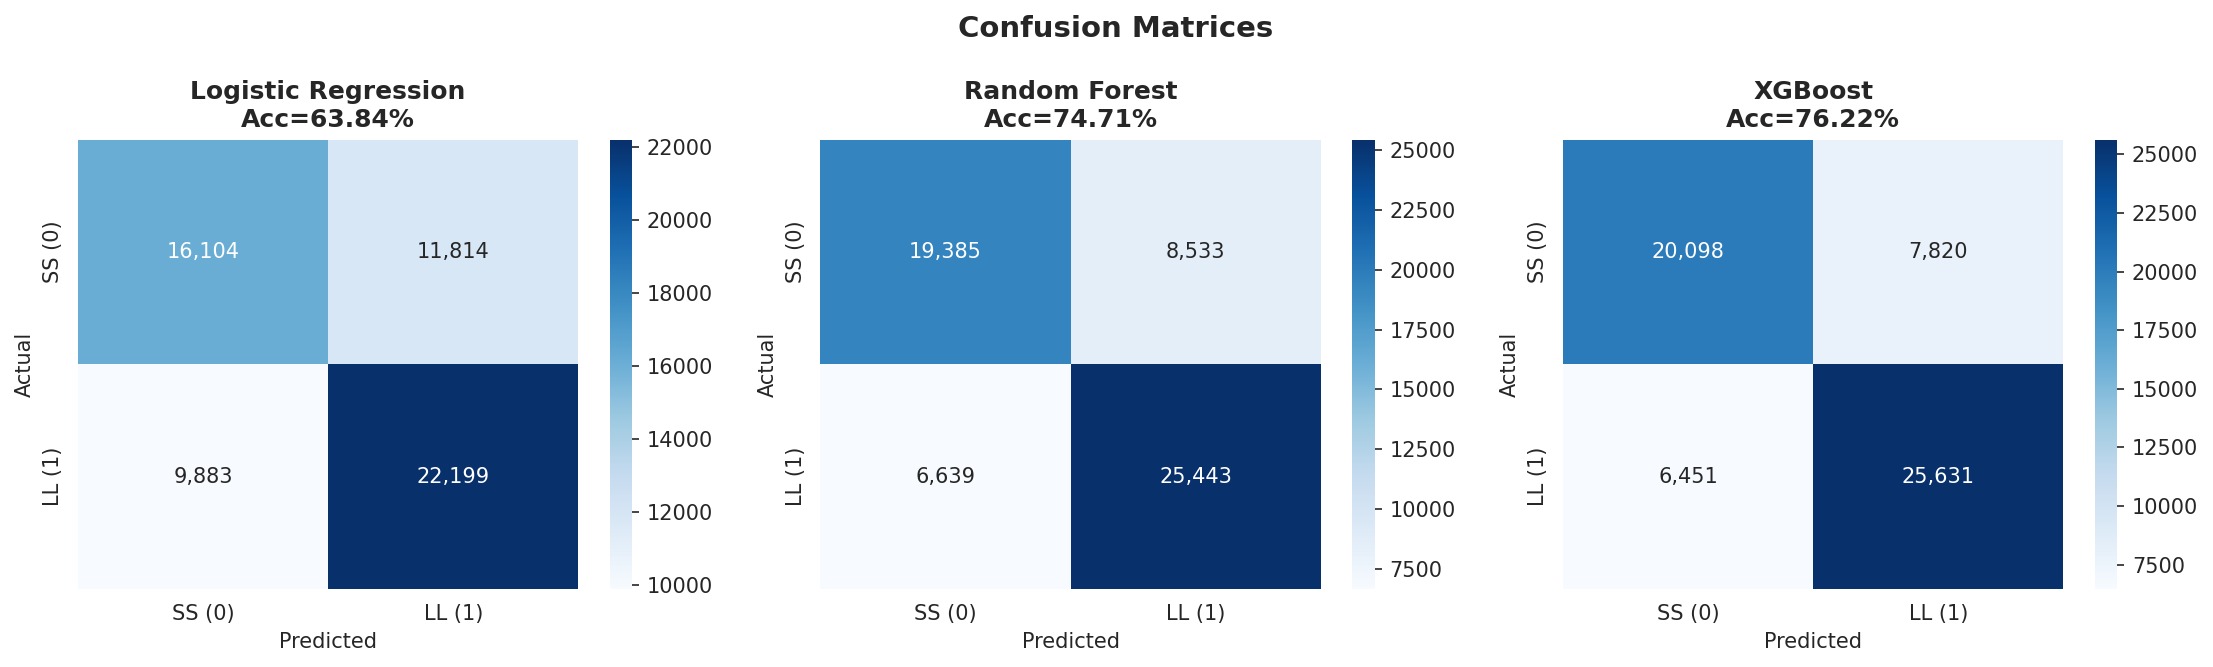
Model Accuracy & AUC-ROC ComparisonModel
All three models substantially outperform the ~50% baseline. XGBoost leads on raw metrics,
but Logistic Regression offers the best interpretability-to-performance trade-off.
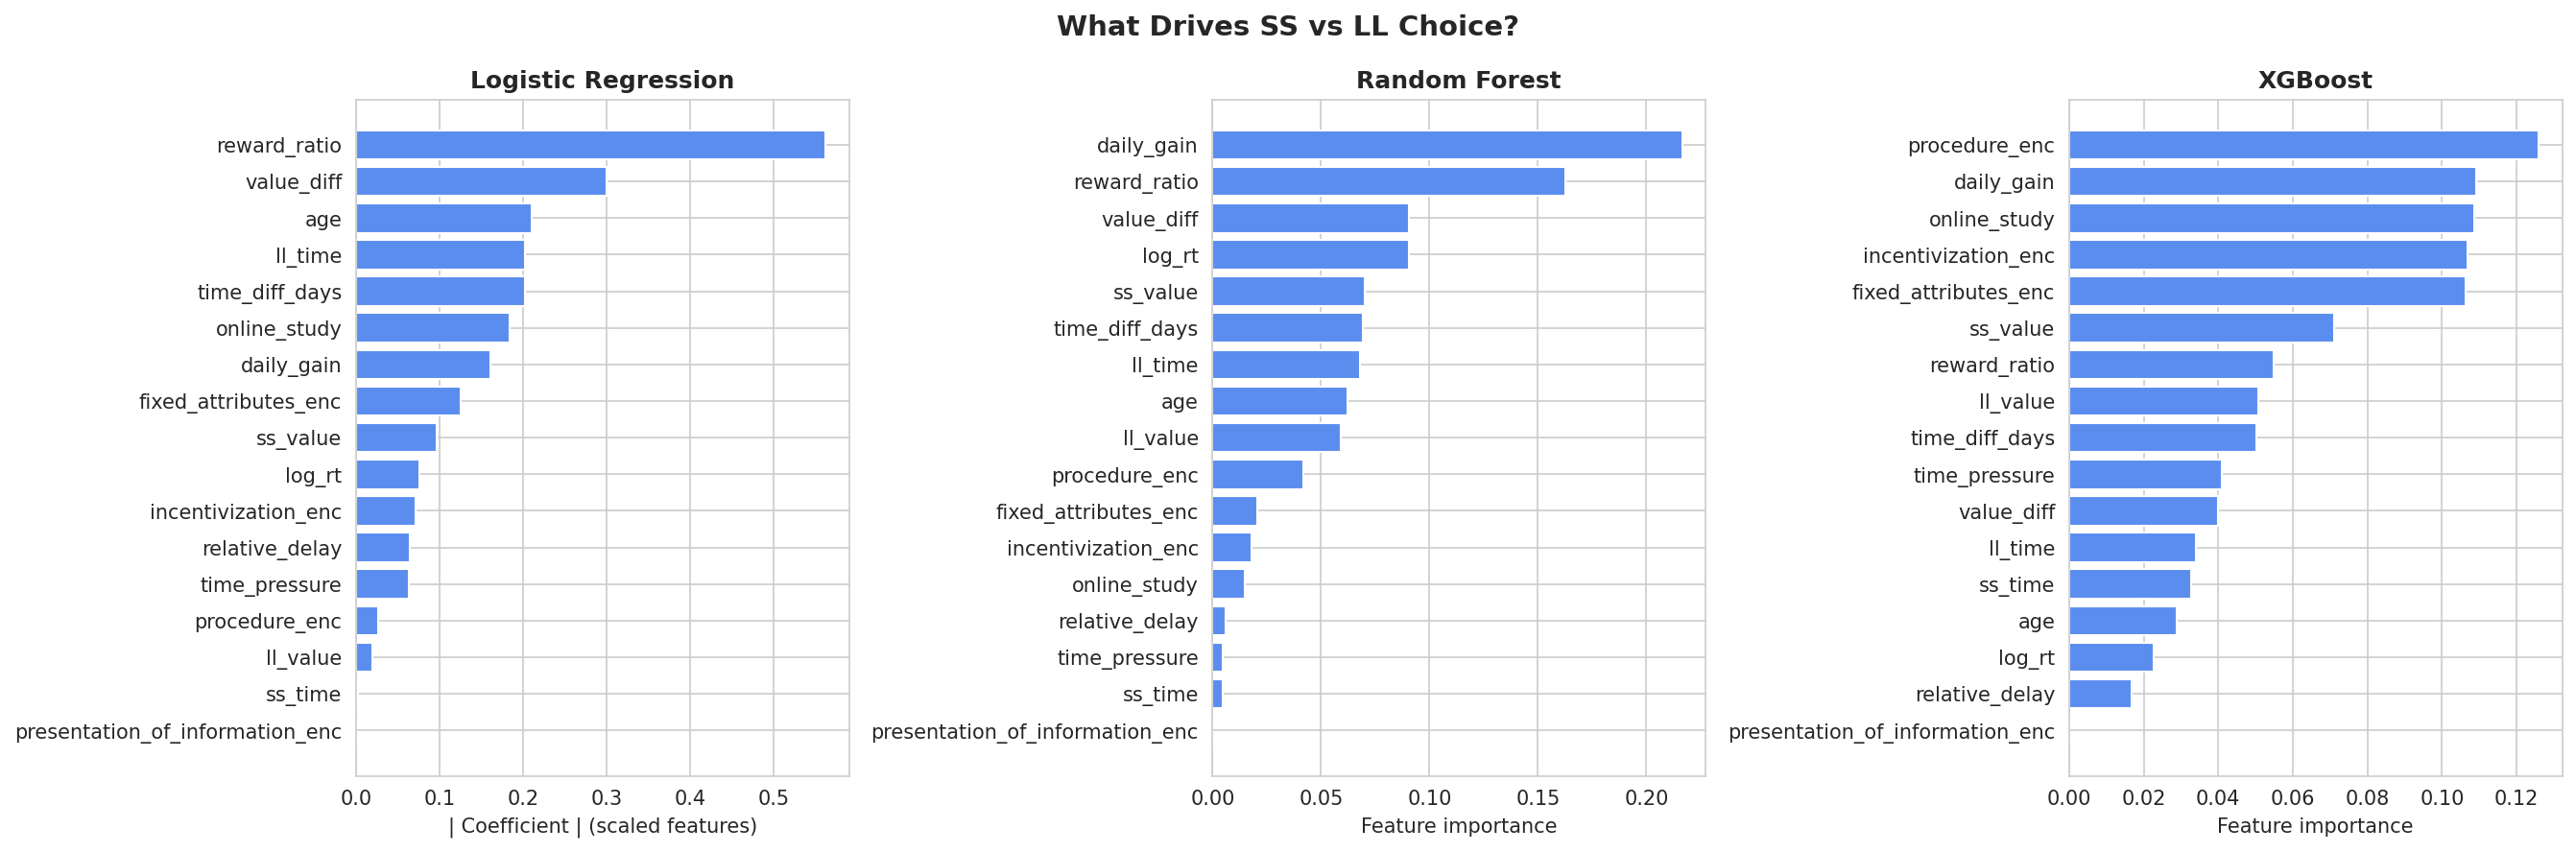
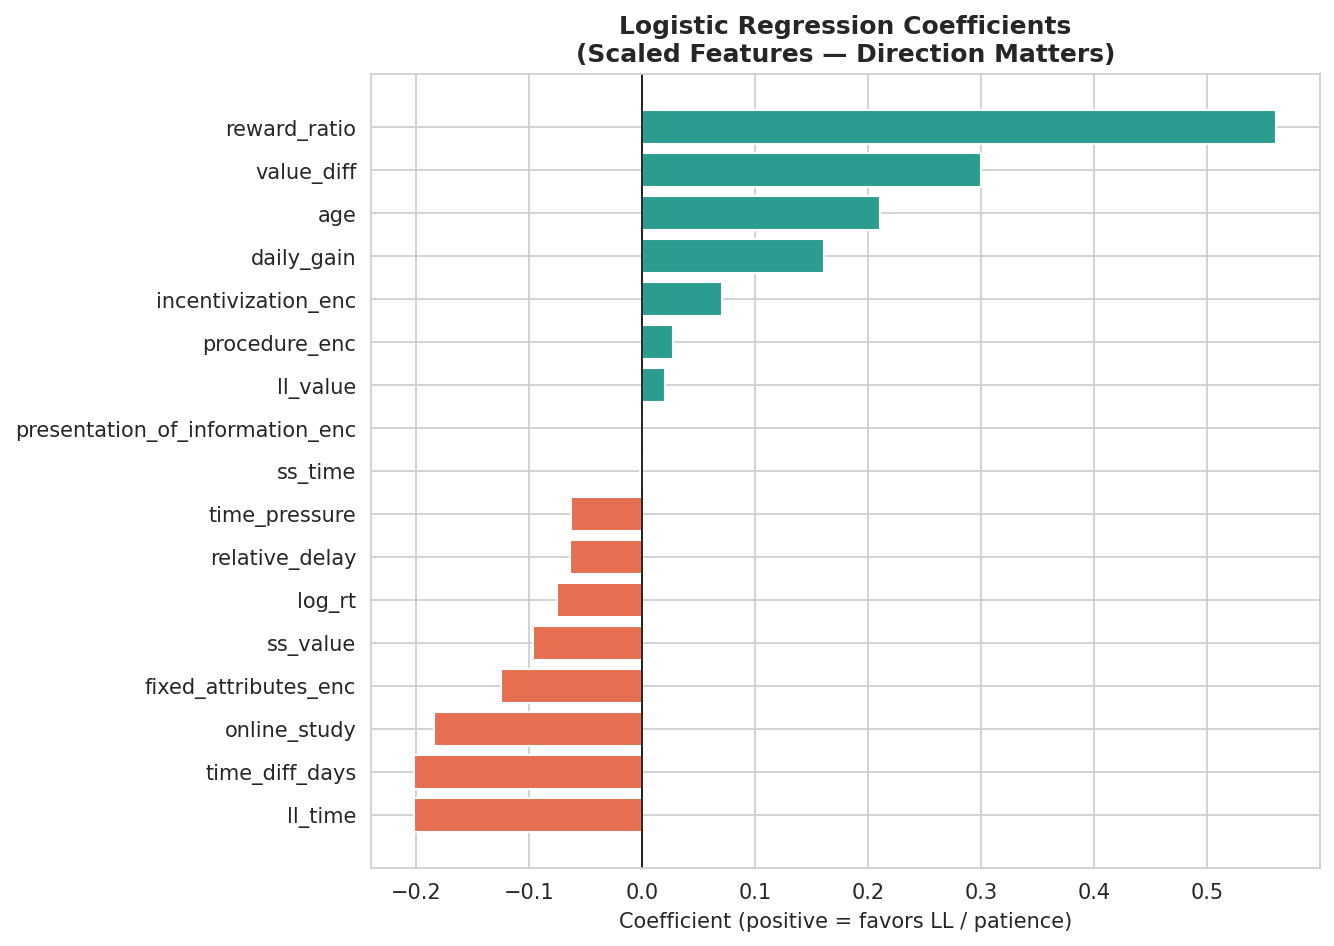
Green bars (positive) push toward LL / patience. Red bars (negative) push toward SS / impatience.
Reward ratio is the strongest positive predictor — confirming our EDA tipping-point finding.
Model selection rationale: We prioritize Logistic Regression for business
recommendations because its coefficients are directly interpretable as effect sizes. The RF and
XGBoost models confirm that additional non-linear signal exists but adds only modest accuracy gains
— validating that the key relationships are approximately linear in this domain.
06 — Business Application
Streaming Subscription Tier Optimization
Our intertemporal choice models map directly to the streaming platform decision:
SS (free/ad-supported tier) = immediate gratification at lower value, vs.
LL (premium tier) = delayed payoff with higher long-term experience quality.
Core question: When will a user choose the premium tier (higher cost, better
long-term experience) over the free tier (instant access, ad-interrupted)? Our models answer this
with quantified thresholds and segment-level predictions.
From Behavioral Science to Platform Strategy
💰
Pricing the Premium Tier
Our 1.29× tipping point means: if the free tier delivers ~$10/month in perceived utility,
the premium must deliver at least ~$12.90. Pricing below this ratio will result in majority
free-tier retention.
🎯
Predicting Convertible Users
Our model predicts LL-tendency (premium-readiness) per user profile. Focus marketing spend
on users whose behavioral signals predict patience — they convert and retain at higher rates.
📣
Upgrade Prompt Design
Procedure type drives ~30pp variation in patience. A/B test HOW the upgrade is presented
(value framing vs. loss aversion vs. social proof) before segmenting by demographics.
📱
Channel-Specific Strategy
Online/mobile users trend ~8pp more impatient. Mobile upgrade prompts need a stronger
value pitch; emphasize immediate benefits ("start watching ad-free tonight").
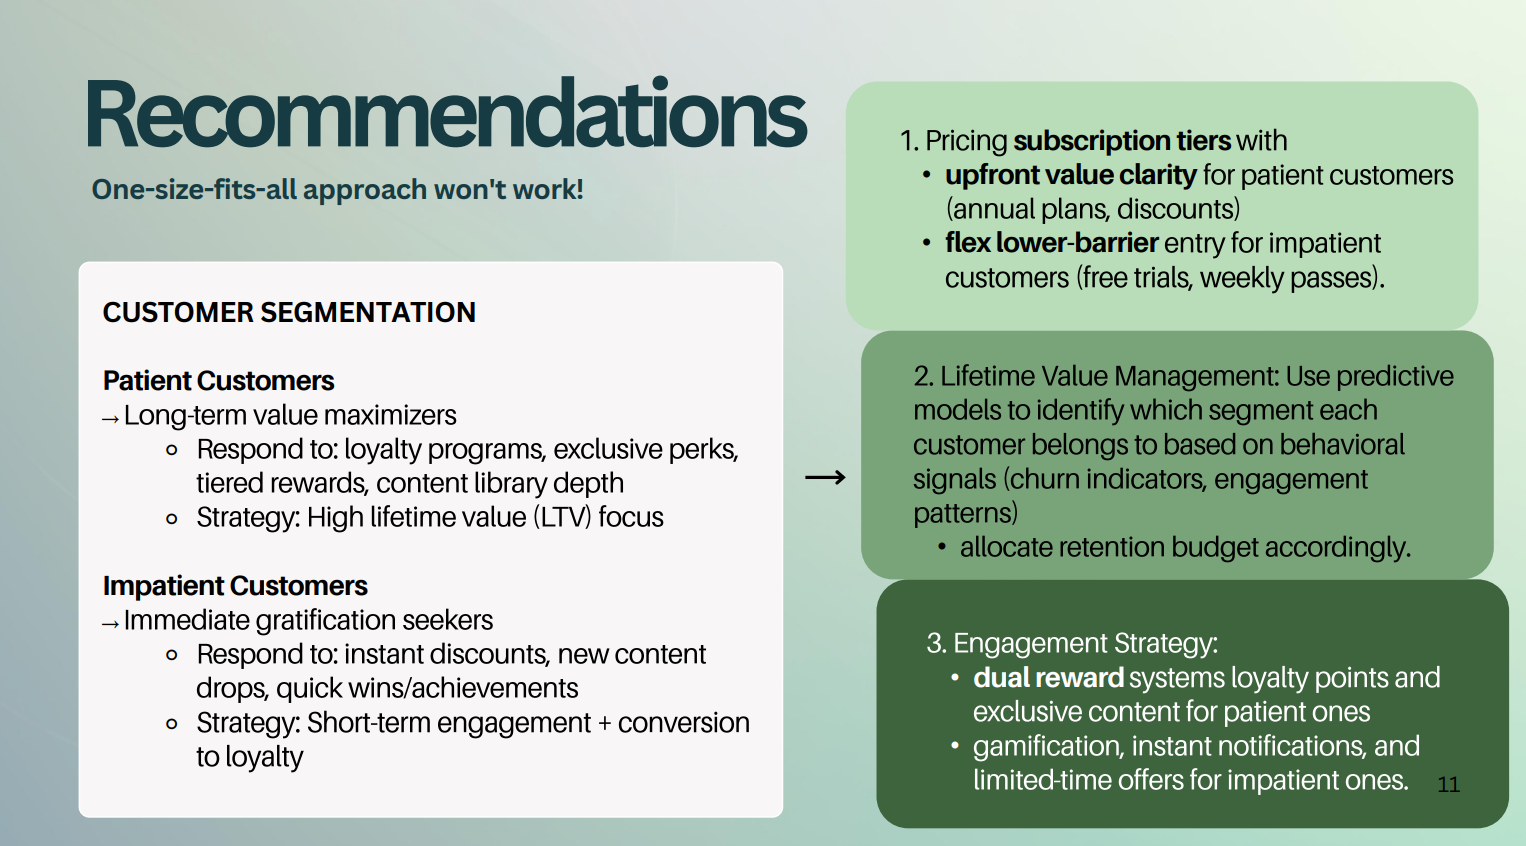
Customer Lifetime Value Segmentation
Our model outputs enable a two-track CLV strategy based on predicted patience profiles:
Predicted LL
High-Patience Segment
Higher expected retention. Target with annual plans and long-term value messaging.
Lower churn risk — invest in relationship depth.
Predicted SS
Impatience Segment
Target with trial offers and month-to-month flexibility. Emphasize instant benefits.
Monitor churn triggers and intervene with retention offers.
Key insight from LR coefficients: The reward_ratio coefficient is the strongest
positive predictor of LL choice. Translating to streaming: for every 10% increase in the premium
tier's perceived value proposition, the probability of choosing the long-term subscription increases
meaningfully — quantifiable from the model's coefficient directly.